Work
BUILDINGS
URBAN
STRATEGY
RESEARCH
Office
EXPERTISE
NEWS
PEOPLE
AWARDS
PUBLICATIONS
CLIENTS
CONTACT
EN
EN
DK
Work
BUILDINGS
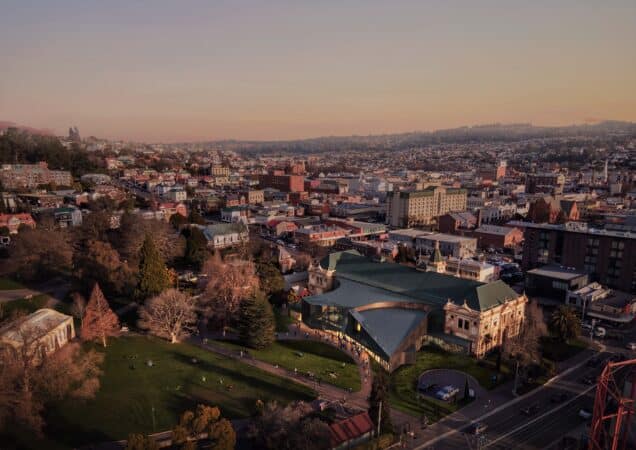
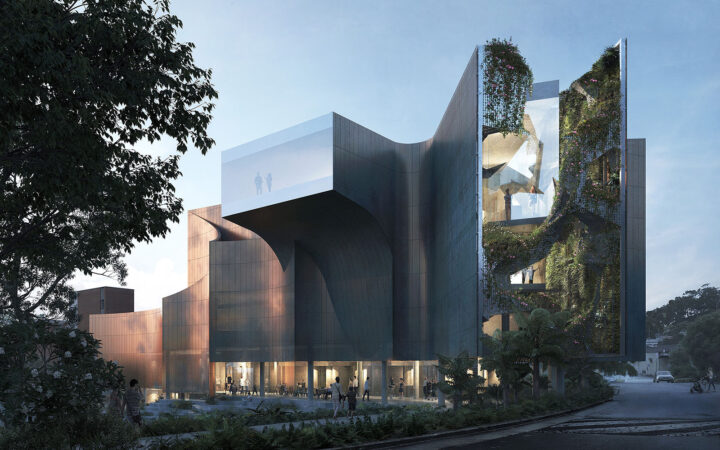
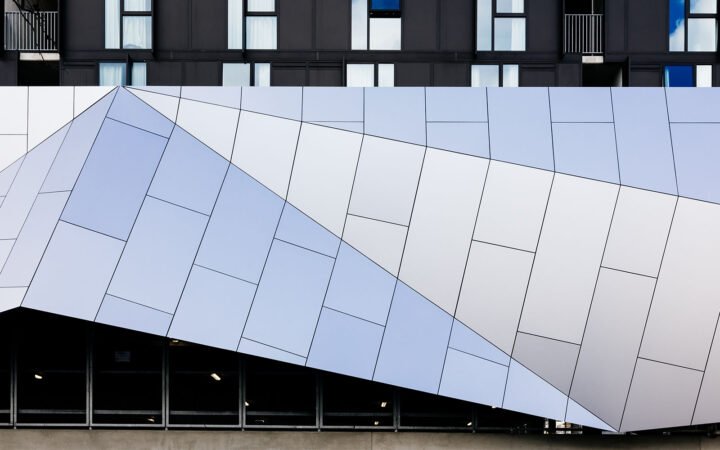
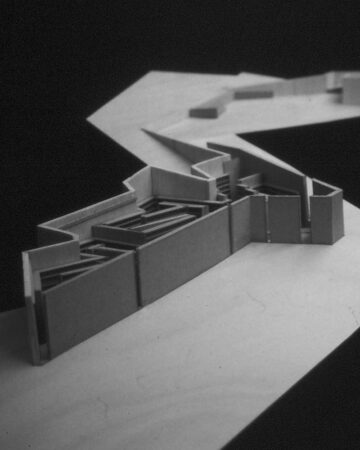
Albert Hall Renewal
LAUNCESTON | AU
Albert Hall Renewal
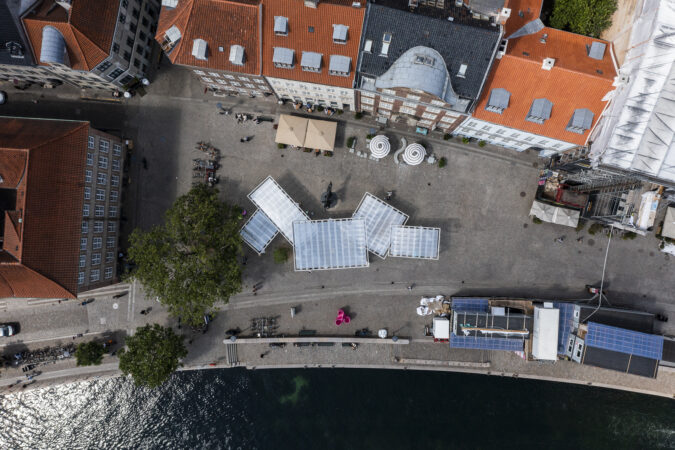
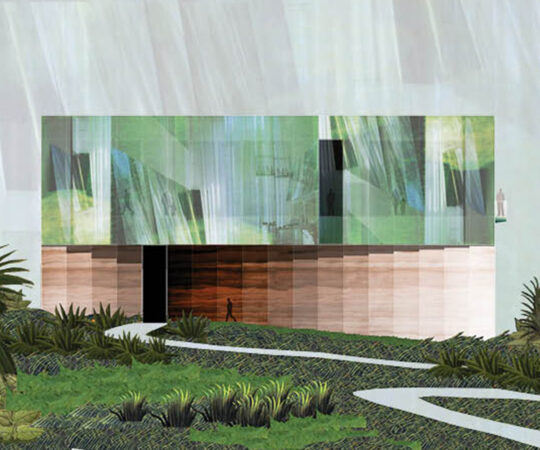
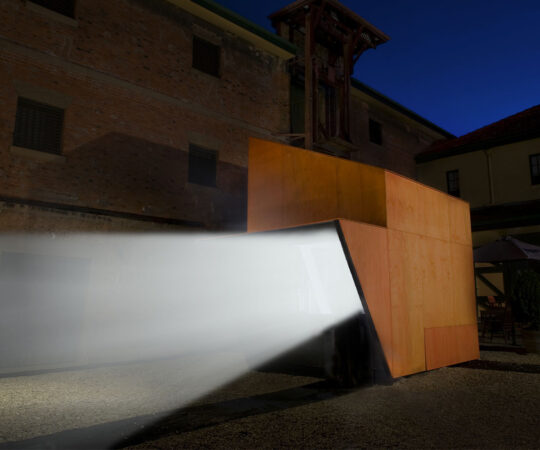
Plastic Pavilion
COPENHAGEN | DK
Plastic Pavilion
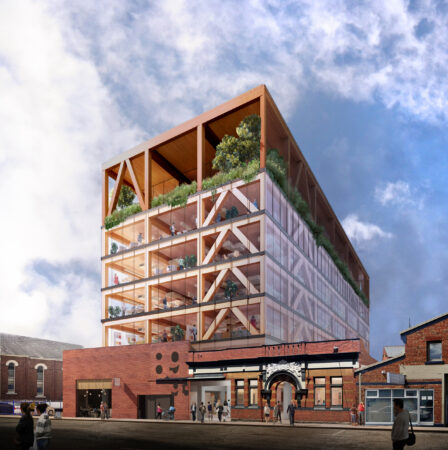
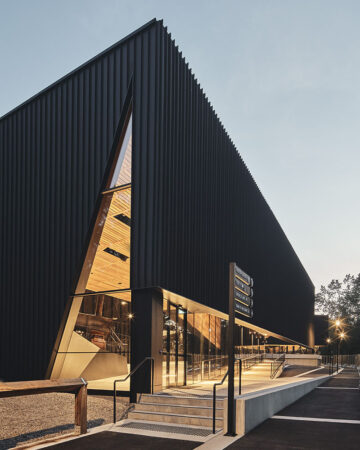
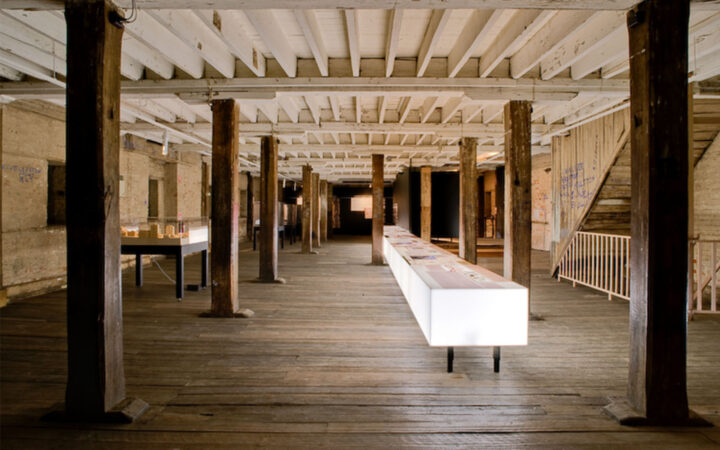
Launceston Timber Tower
LAUNCESTON | AU
Launceston Timber Tower
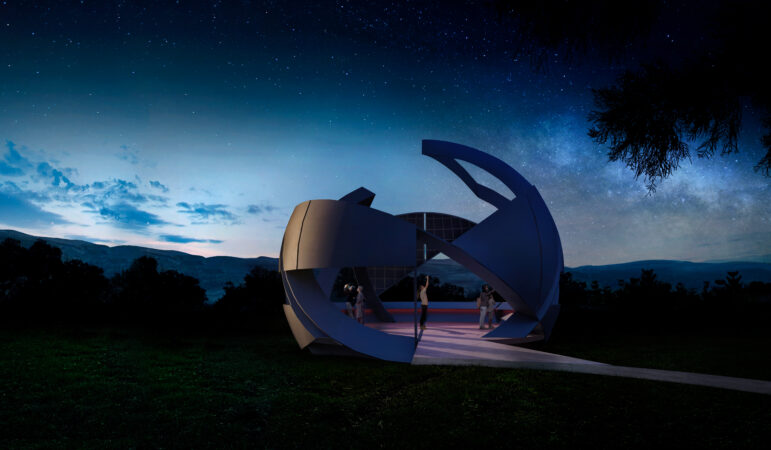
Mallanganee Lookout
MALLANGANEE | AU
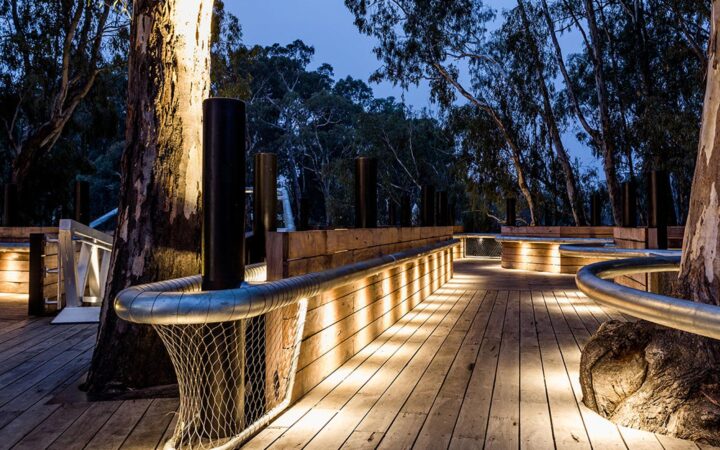
Mallanganee Lookout
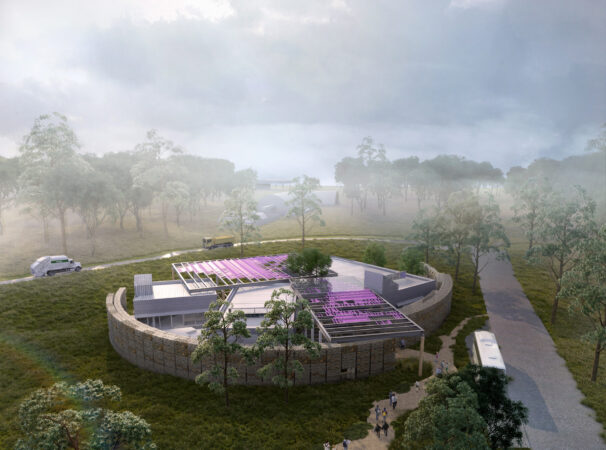
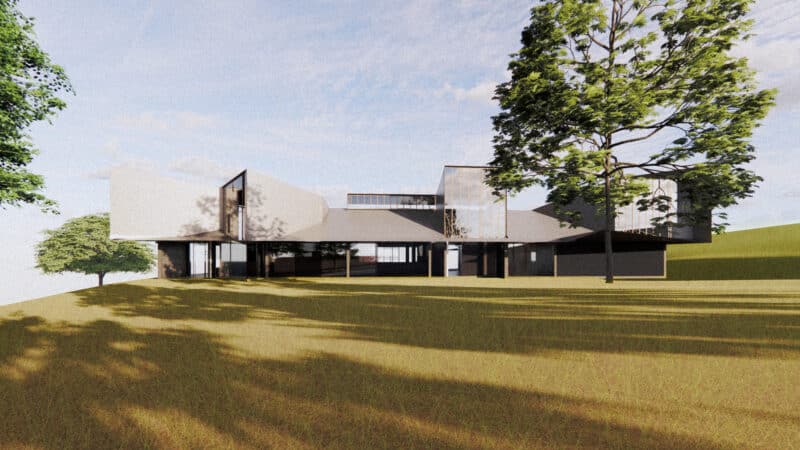
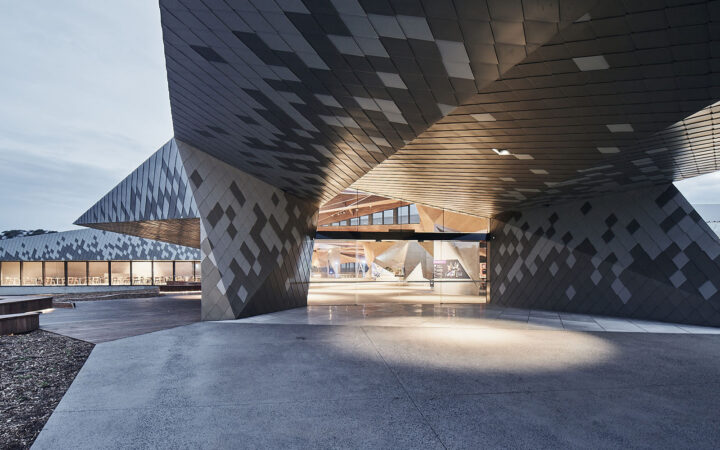
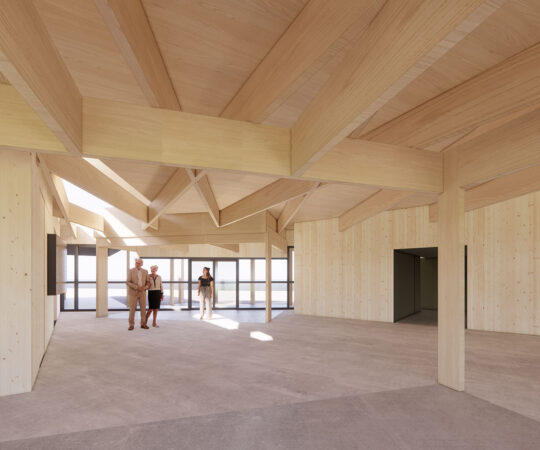
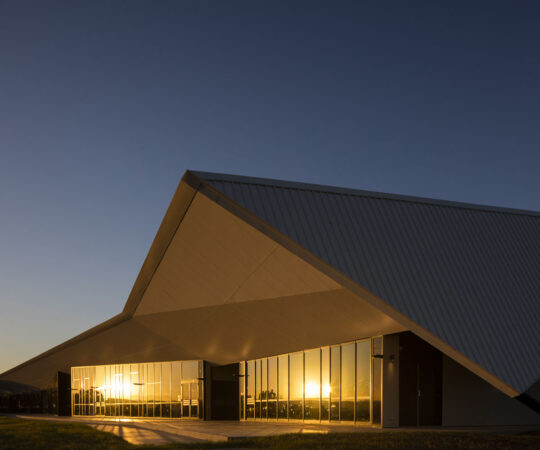
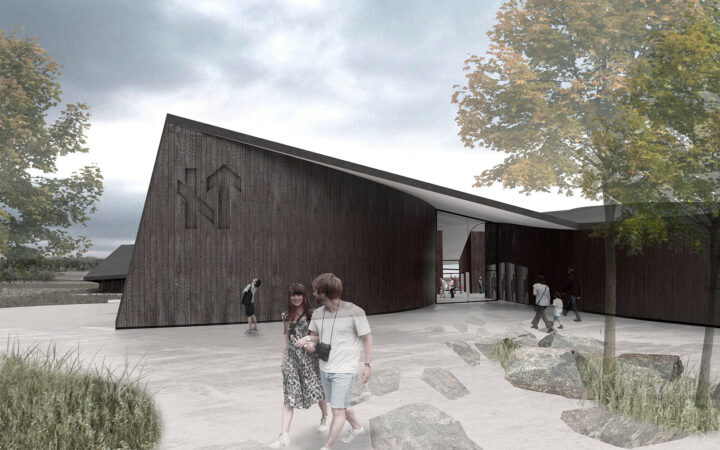
Resource Recovery and Learning Centre
NOWRA | AU
Resource Recovery and Learning Centre
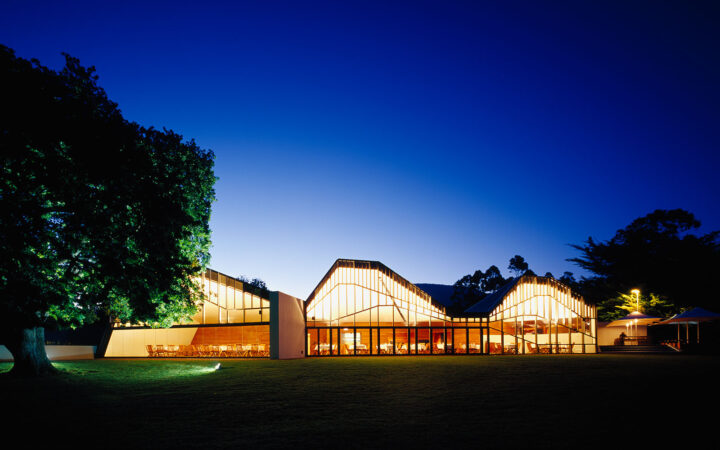
Puffing Billy Railway Visitor Centre
Dandenong Ranges | AU
Puffing Billy Railway Visitor Centre
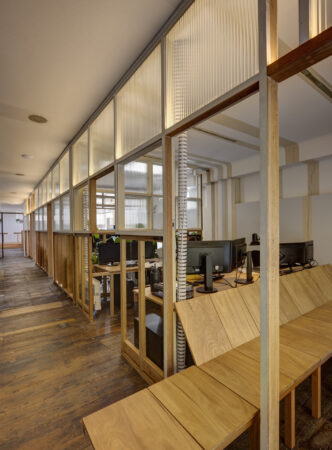
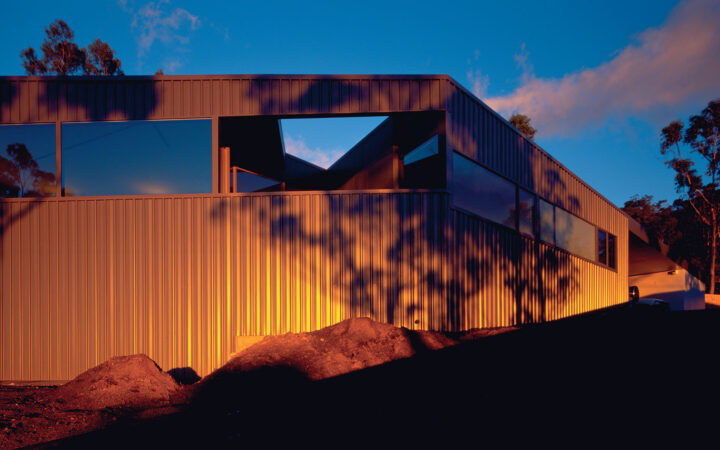
Hobart Office
Hobart | AU
Hobart Office
Rouse Hill Anglican College: Senior Studies Building
ROUSE HILL | AU
Rouse Hill Anglican College: Senior Studies Building
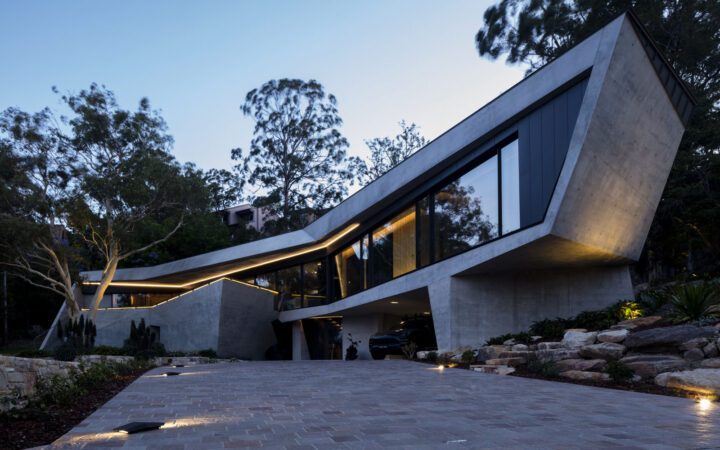
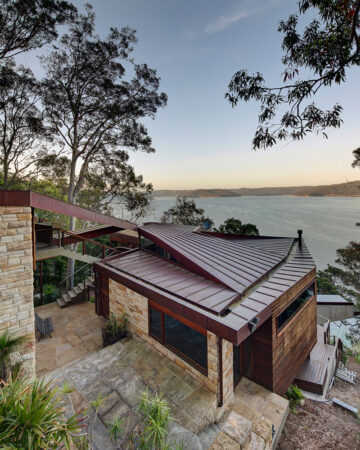
Dural House
Sydney | AU
Dural House
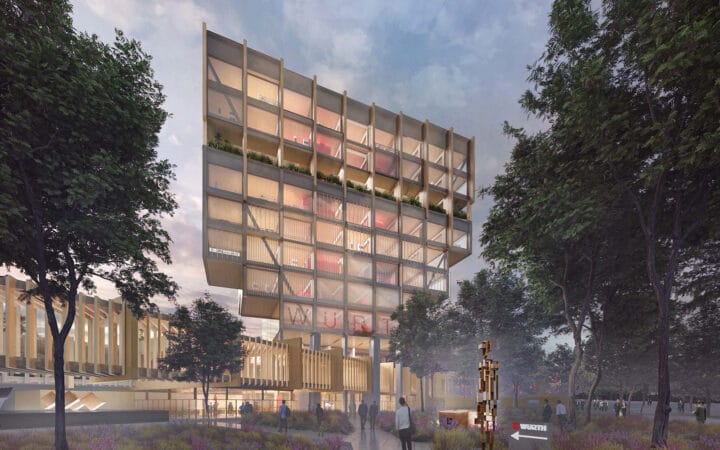
Würth
Gaisbach | DE
Würth
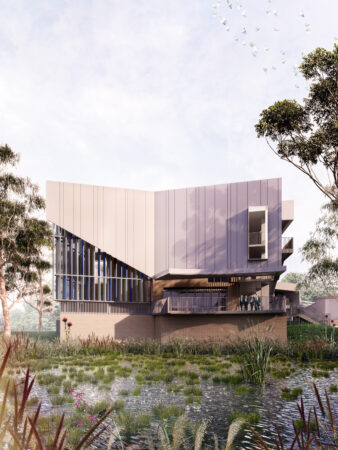
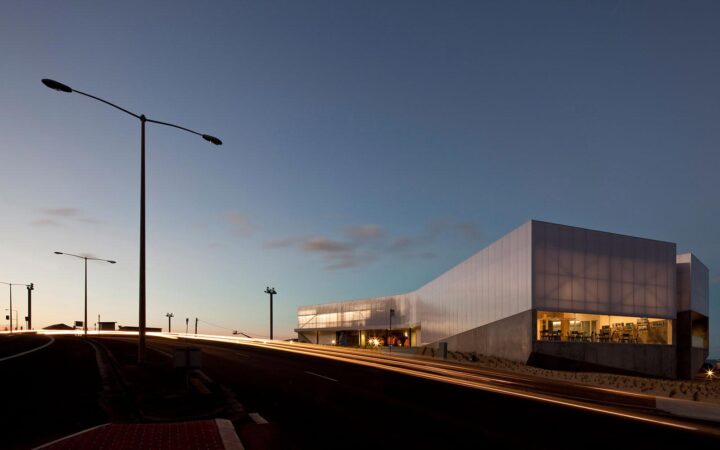
Penguin Parade Visitor Centre
Philip Island | AU
Penguin Parade Visitor Centre
Warriewood Valley Community Centre
Northern Beaches | AU
Warriewood Valley Community Centre
Barangaroo Pavilion
Barangaroo | AU
Barangaroo Pavilion
Castle Cove House
Sydney | AU
Castle Cove House
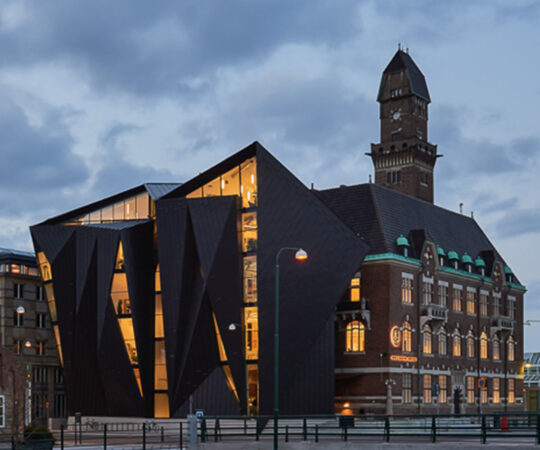
Tornhuset
Malmo | SE
Tornhuset
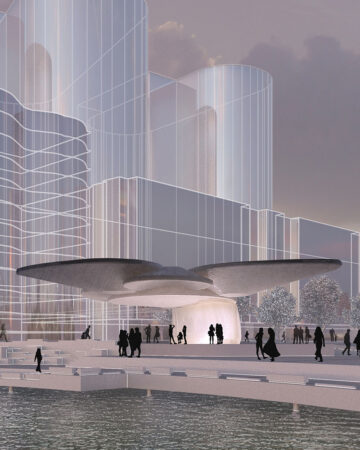
National Museum of Finland
Helsinki | FI
National Museum of Finland
North West Museum and Art Gallery
Burnie | AU
North West Museum and Art Gallery
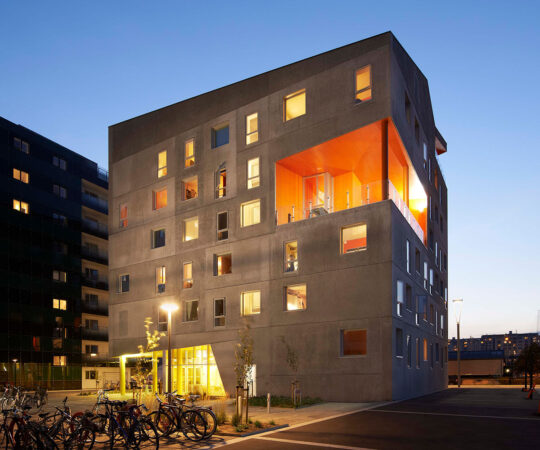
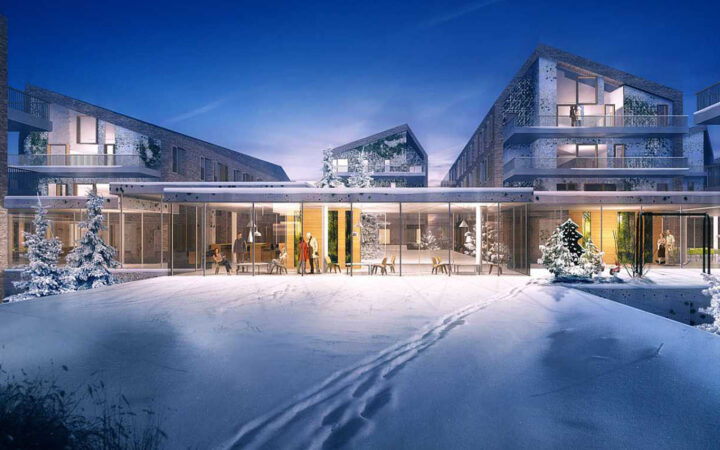
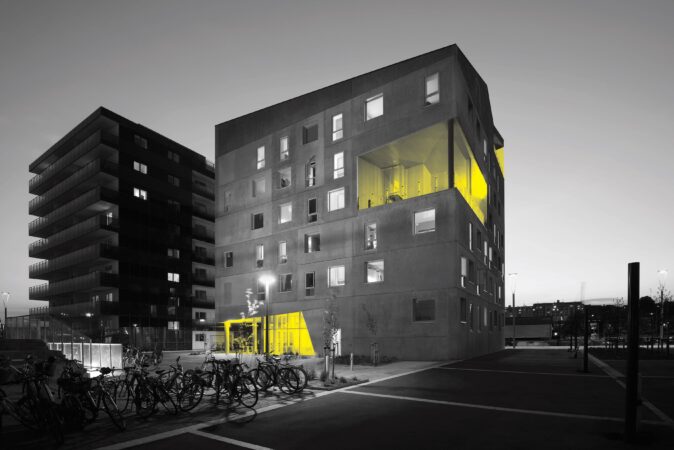
Vulkanen Student Housing
Aarhus | DK
Vulkanen Student Housing
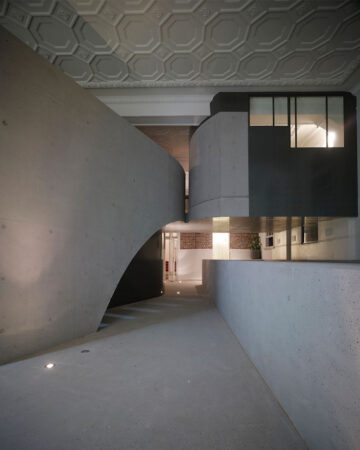
Institute for Marine and Antarctic Studies
Hobart | AU
Institute for Marine and Antarctic Studies
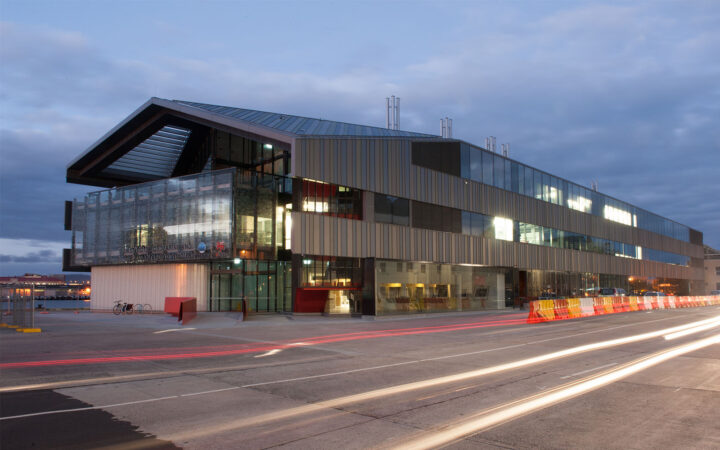
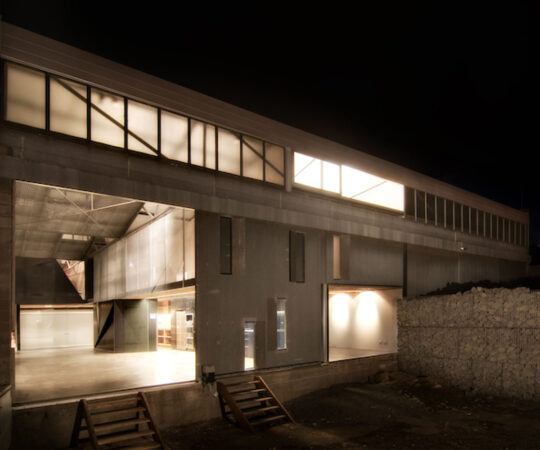
Burnie Makers Workshop
Burnie | AU
Burnie Makers Workshop
Hobart City University Apartments
Hobart | AU
Hobart City University Apartments
Penrith Anglican College
Penrith | AU
Penrith Anglican College
Australian National Botanic Gardens Conservatory
Canberra | AU
Australian National Botanic Gardens Conservatory
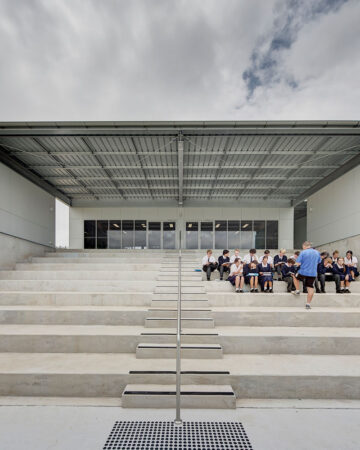
Shellharbour School
Shellharbour | AU
Shellharbour School
Bispebjerg Hospital
Copenhagen I DK
Bispebjerg Hospital
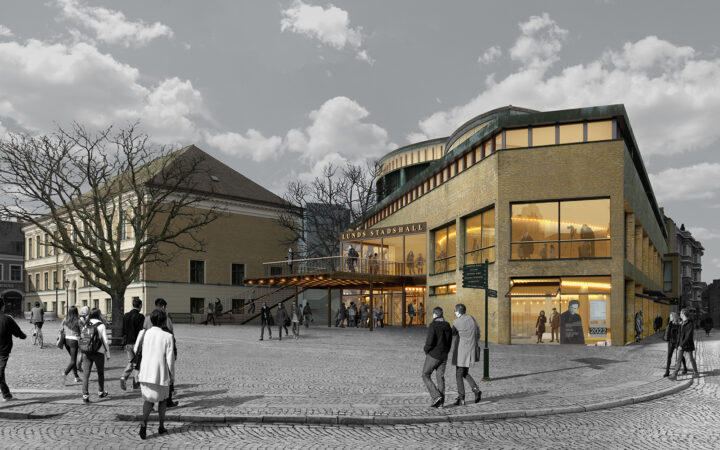
Stadshallen in Lund
Lund | SE
Stadshallen in Lund
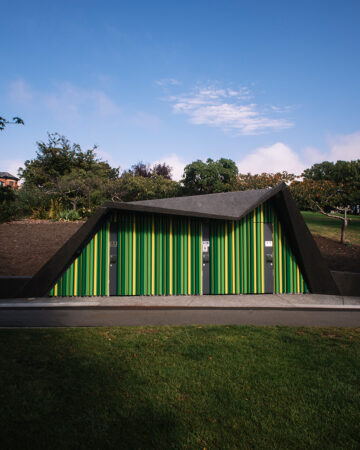
Princes Park Amenities
Hobart | AU
Princes Park Amenities
Richmond House
Richmond | AU
Richmond House
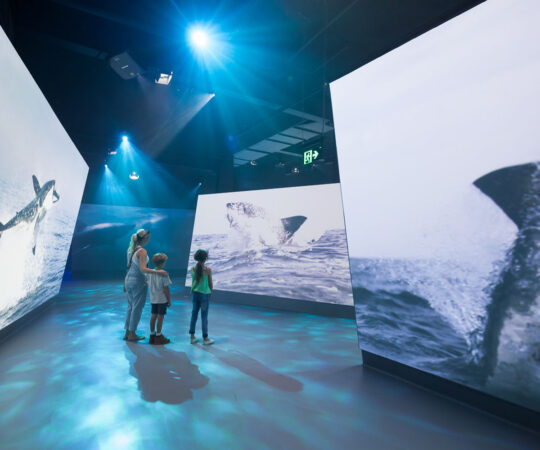
Ocean Discovery Centre
Phillip Island | AU
Ocean Discovery Centre
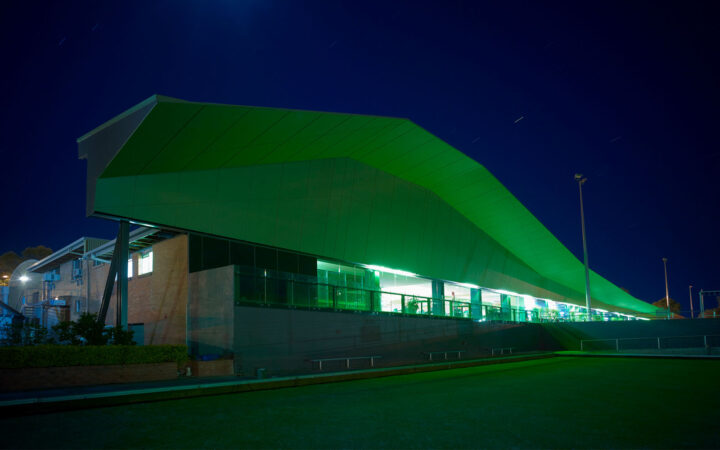
Maitland City Bowling Club
Maitland | AU
Maitland City Bowling Club
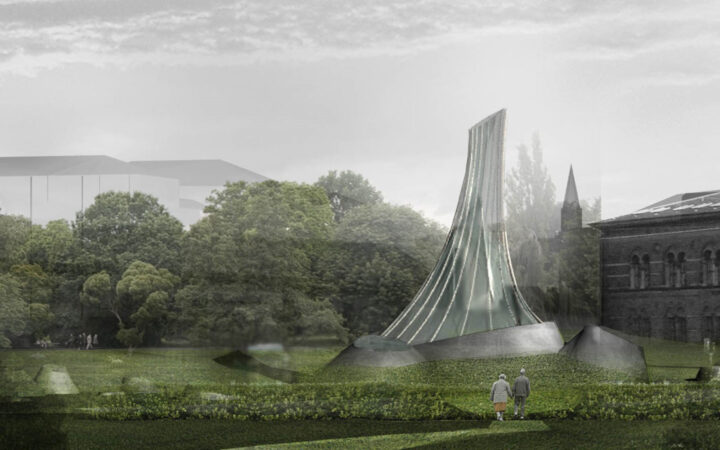
Statens Naturhistoriske Museum
København | DK
Statens Naturhistoriske Museum
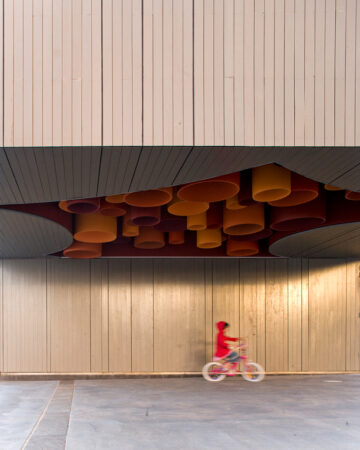
Commonwealth Place Kiosks
Canberra | AU
Commonwealth Place Kiosks
Trelleborg Visitor Centre
Trelleborg | DK
Trelleborg Visitor Centre
Clareville House
Pittwater | AU
Clareville House
Smith St (ware)house
Hobart | AU
Smith St (ware)house
Leichhardt House
Sydney | AU
Leichhardt House
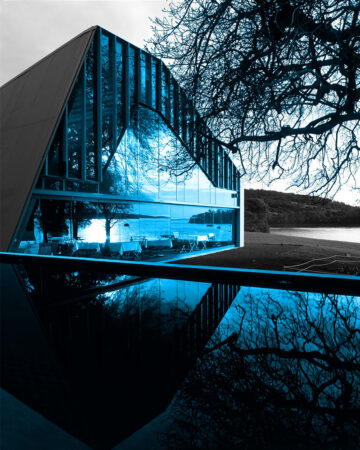
Peppermint Bay
Woodbridge | AU
Peppermint Bay
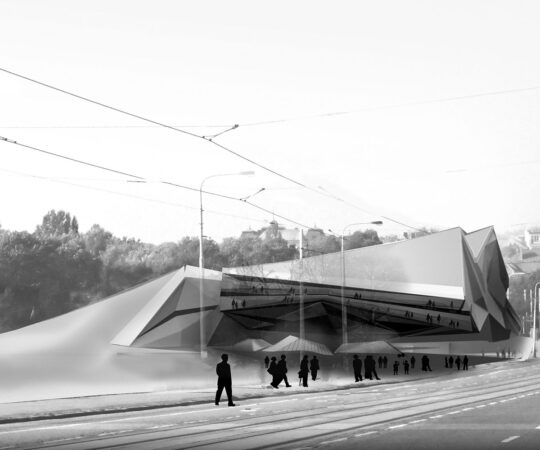
National Library in Prague
Prague | CZ
National Library in Prague
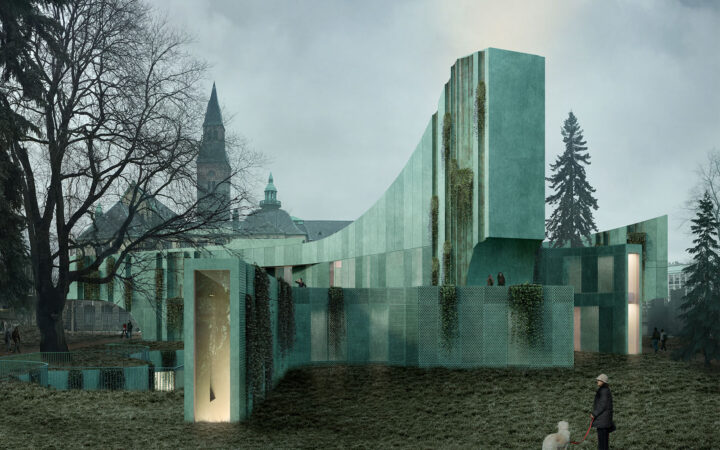
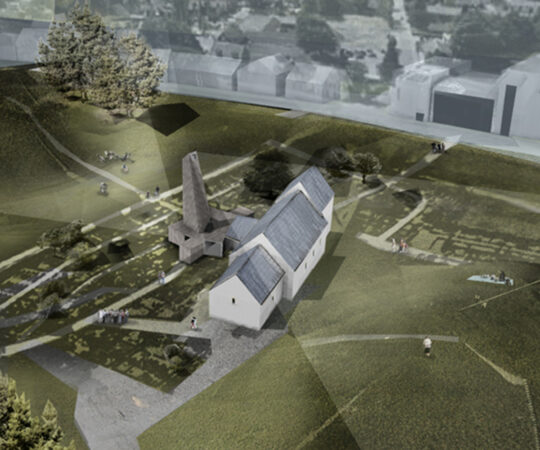
Jellingestenene Visitor Centre
Jellinge | DK
Jellingestenene Visitor Centre
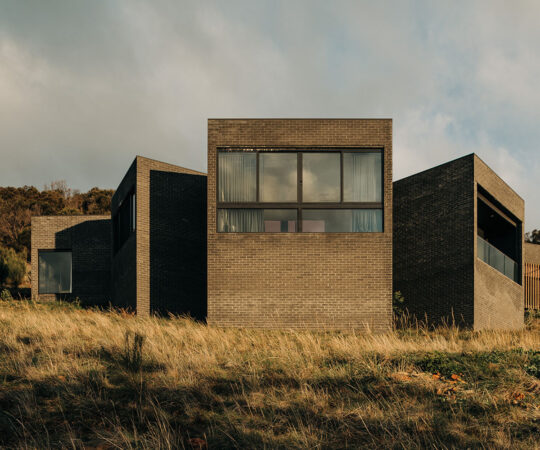
Tolmans Hill House
Hobart | AU
Tolmans Hill House
Fish 349
Hobart | AU
Fish 349
Liverpool Crescent House
Hobart | AU
Liverpool Crescent House
Møns Klint
Møn | DK
Møns Klint
New South Wales College of Fine Arts
Sydney | AU
New South Wales College of Fine Arts
Canberra Library and Studio
Canberra | AU
Canberra Library and Studio
Orange Line
Granton | AU
Orange Line
STRATEGY
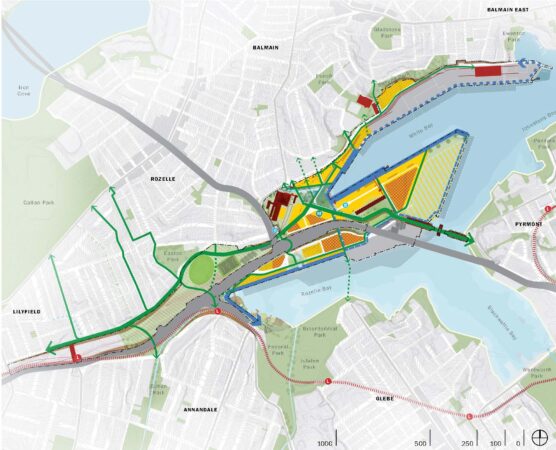
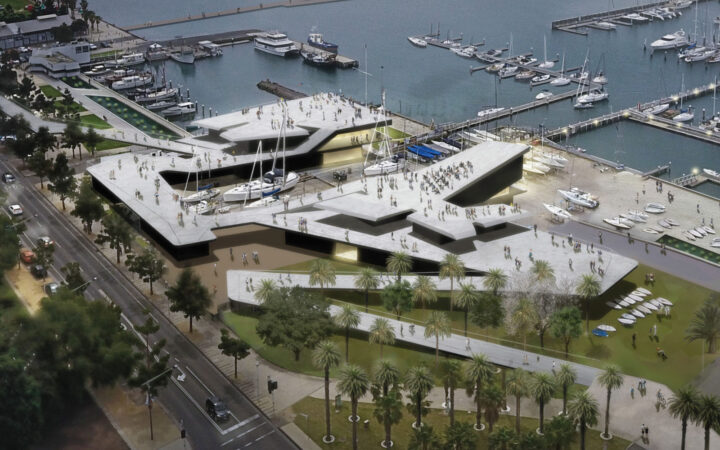
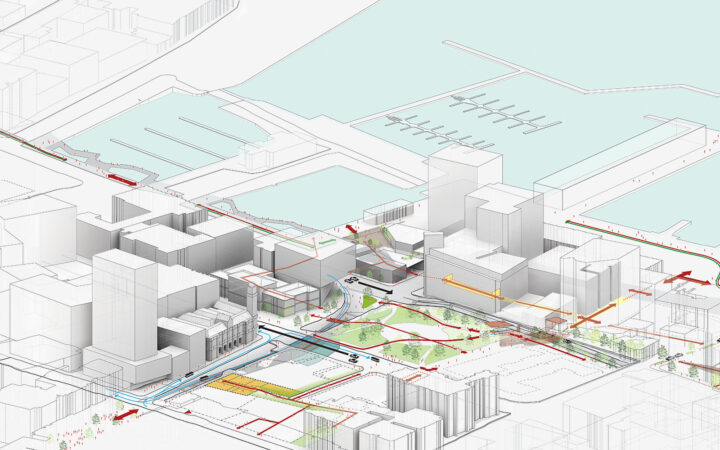
Bays West
Sydney | AU
Bays West
Kongelunden
Aarhus | DK
Kongelunden
White Bay Power Station
Sydney | AU
White Bay Power Station
Circular Quay
Sydney | AU
Circular Quay
Parramatta
Parramatta | AU
Parramatta
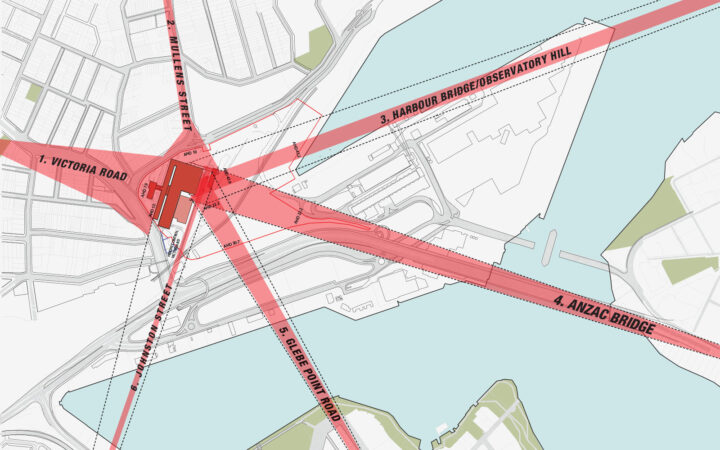
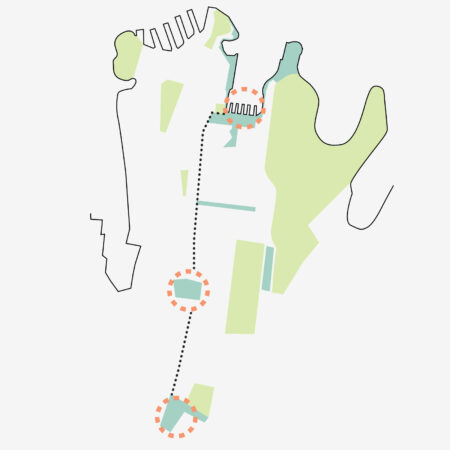
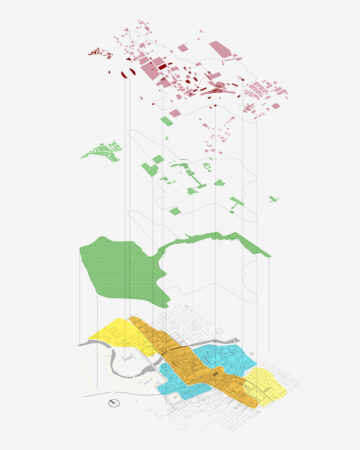
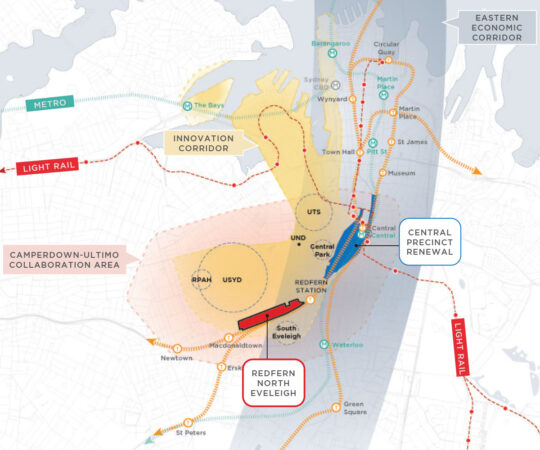
Redfern North Eveleigh
Redfern | AU
Redfern North Eveleigh
Bispebjerg Hospital
Copenhagen I DK
Bispebjerg Hospital
URBAN
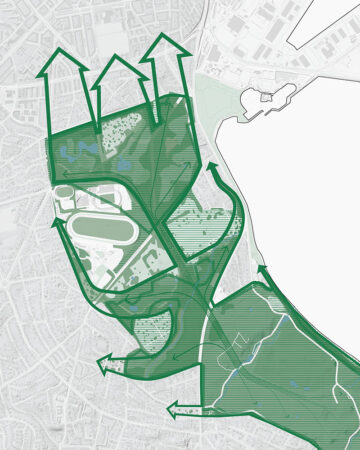
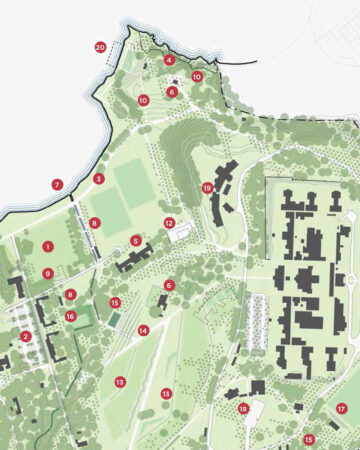
Callan Park
Sydney | AU
Callan Park
Atlassian Central
Sydney | AU
Atlassian Central
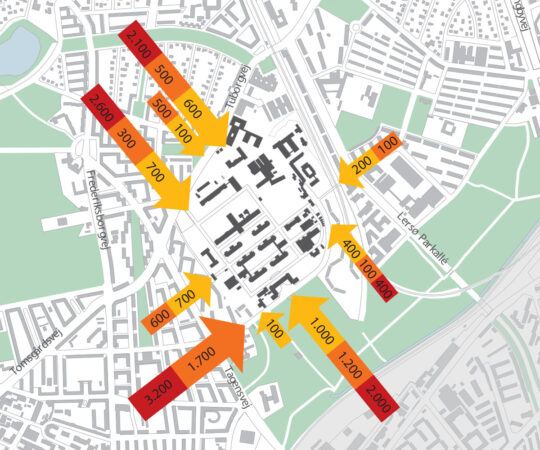
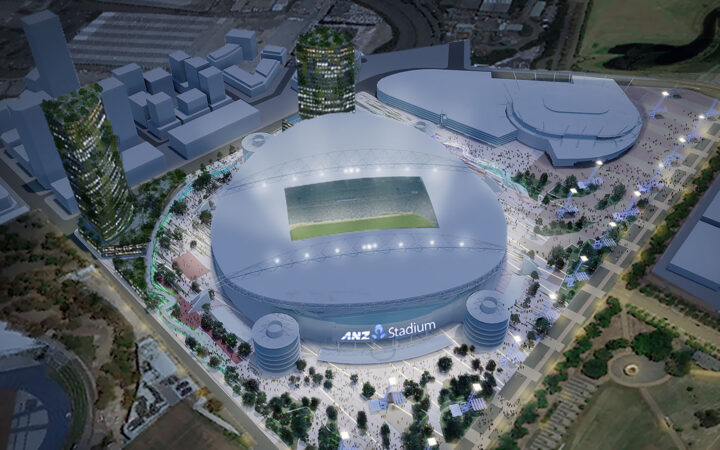
Stadia Precinct
Sydney | AU
Stadia Precinct
Koondrook Wharf
Koondrook | AU
Koondrook Wharf
Geelong Waterfront
Geelong | AU
Geelong Waterfront
Kulkransporet
Aarhus | DK
Kulkransporet
Forecourt for Institute of Marine and Antarctic Studies
Hobart | AU
Forecourt for Institute of Marine and Antarctic Studies
Henriksholm
Vedbæk | DK
Henriksholm
George Street Plaza
Sydney | AU
George Street Plaza
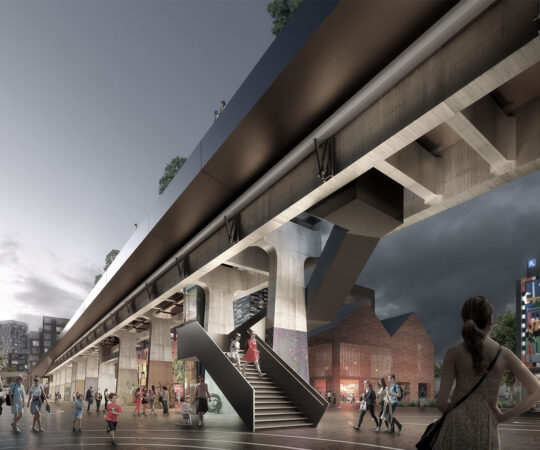
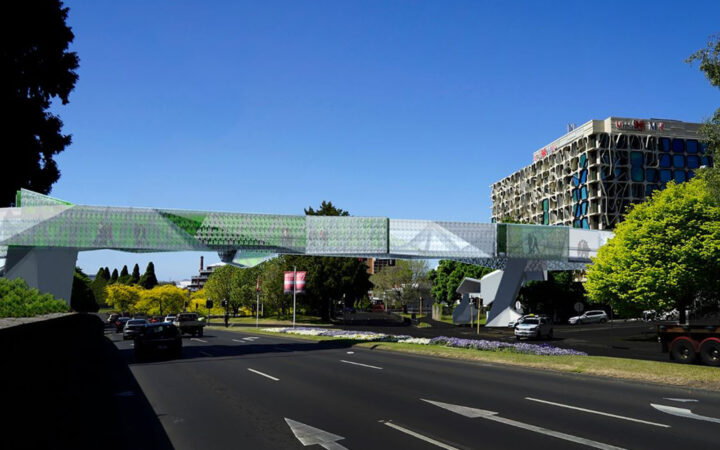
Brooker Bridge
Hobart | AU
Brooker Bridge
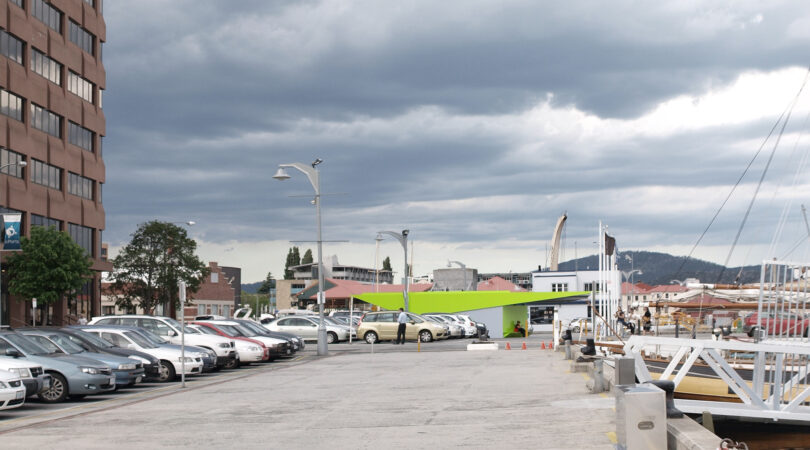
Elizabeth Street Pier Service Building
Hobart | AU
Elizabeth Street Pier Service Building
Tasmanian Museum and Art Gallery
Hobart | AU
Tasmanian Museum and Art Gallery
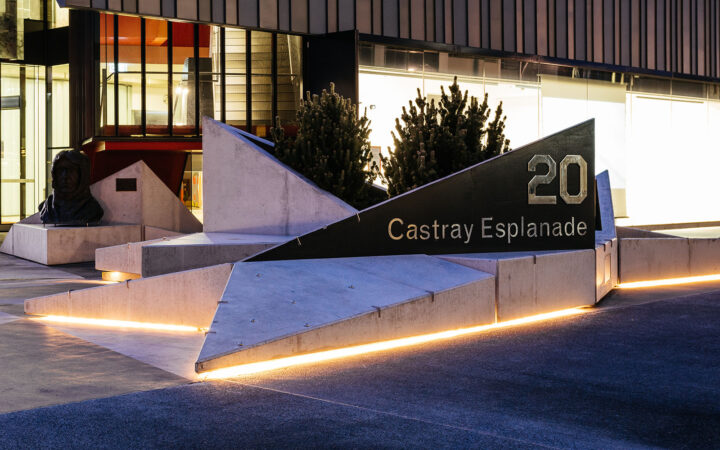
Forecourt at Tasmanian Museum and Art Gallery
Hobart | AU
Forecourt at Tasmanian Museum and Art Gallery
Heavy Metals Lab
Hobart | AU
Heavy Metals Lab
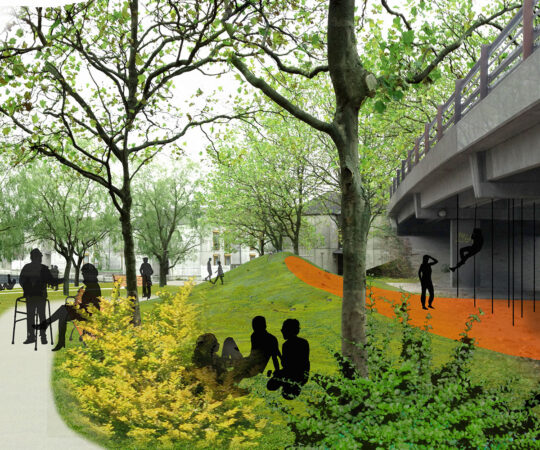
City to Cove
Hobart | AU
City to Cove
RESEARCH
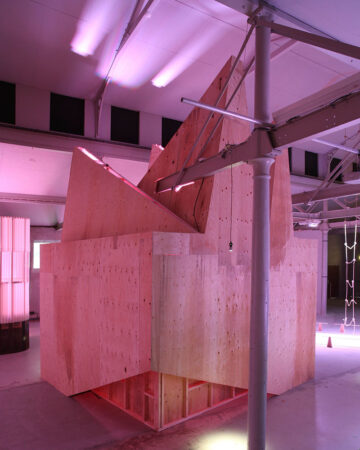
Third Spaces
Third Spaces
Instruments
Instruments
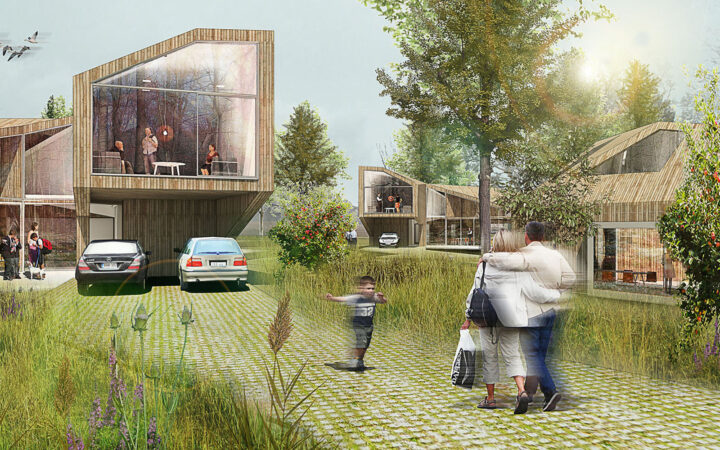
Housing Diversity
Housing Diversity
Relational Architecture
Relational Architecture
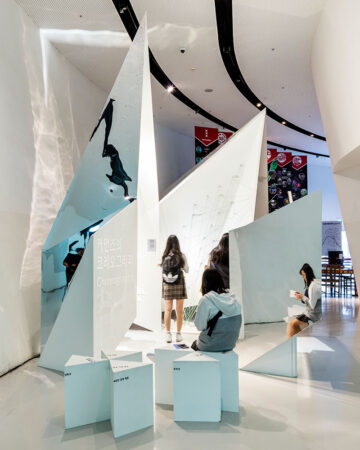
Seoul Biennale
Seoul | KP
Seoul Biennale
Intergenerational City
Intergenerational City
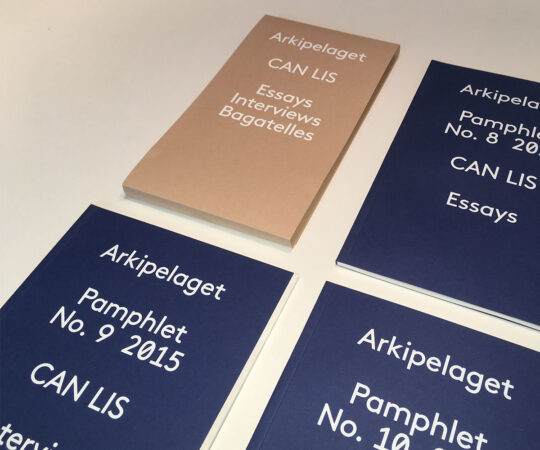
Can Lis
Can Lis
Energy at MAXXI
Rome | IT
Energy at MAXXI
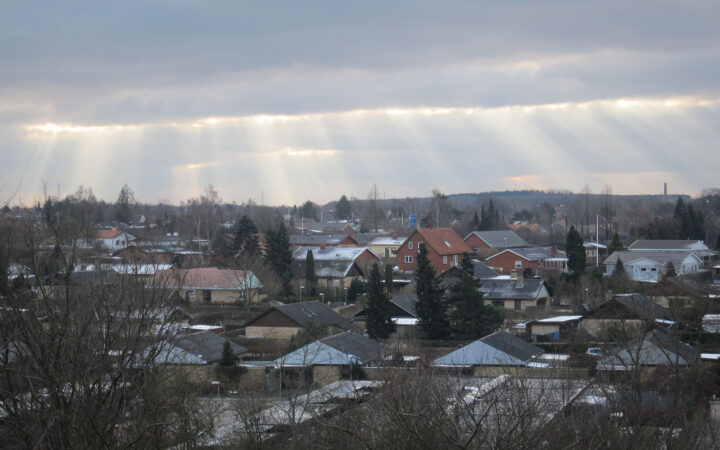
Suburban Renewal
Fuglebakken and Fløng I DK
Suburban Renewal
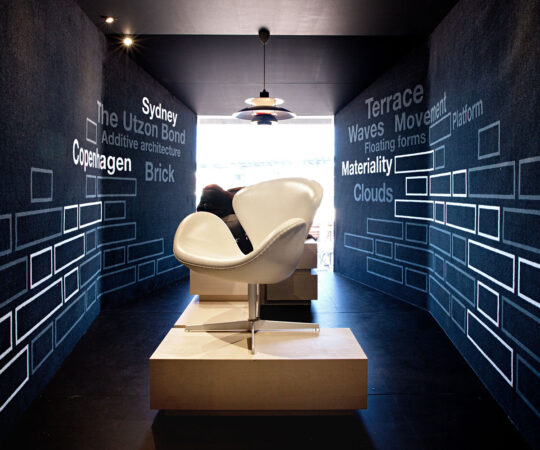
Danish Design at the Sydney Opera House
Sydney | AU
Danish Design at the Sydney Opera House
Measuring Up
Measuring Up
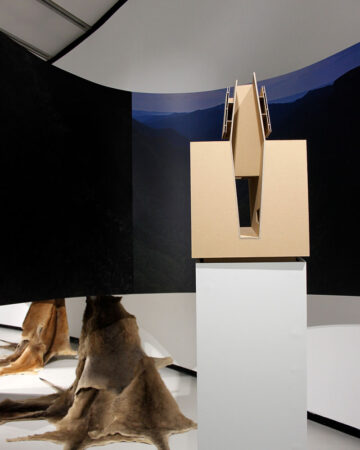
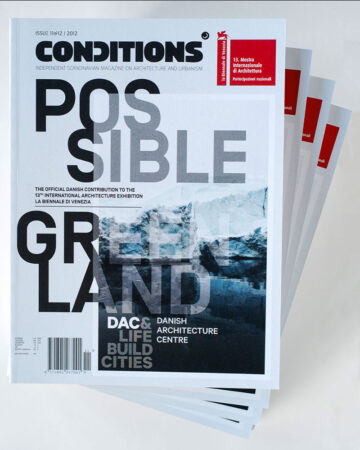
Possible Greenland
Possible Greenland
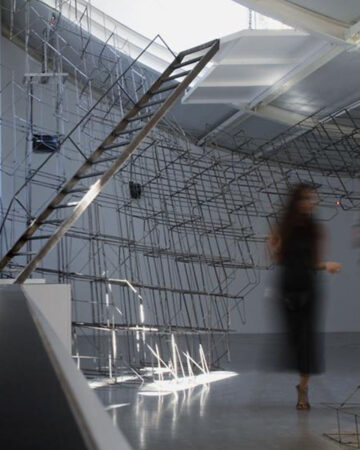
Formations Venice Biennale
Formations Venice Biennale
Building Blocks
Stockholm | SE
Building Blocks
Cosmopolitan Ground
Cosmopolitan Ground
EN
EN
DK
EN
EN
DK